
Hi everyone! My name is Arthur and I'm a Python developer. I want to share my experience with Apache Superset and tell you how we used it to visualize large amounts of data in PivotTables. If you get out of the Sandbox *, I promise to add other useful articles.
Apache Superset is a powerful data visualization tool that is widely used in the Open-Source community. Its main advantages are:
But despite all these advantages, in practical application there may be problems associated with the need to correctly configure and optimize Superset for specific tasks. For example, some users may lack existing types of visualization, or they may not be productive enough for their data volumes. Therefore, often the original "boxed" functionality of Apache Superset is not enough, and then you need to start refining it for your needs, which Superset allows you to do.
Apache Superset is a powerful data visualization tool that is widely used in the Open-Source community. Its main advantages are:
- Ease of use: Superset has a simple and intuitive interface that allows users to quickly create beautiful and informative charts and reports.
- Scalability: Superset can easily scale and handle large amounts of data.
- Support for many data sources: Superset supports many data sources, including SQL databases, Hadoop, Apache Druid, Elasticsearch, and many others.
- Extensibility: Superset can be extended using various plugins, which allows you to customize it under times
But despite all these advantages, in practical application there may be problems associated with the need to correctly configure and optimize Superset for specific tasks. For example, some users may lack existing types of visualization, or they may not be productive enough for their data volumes. Therefore, often the original "boxed" functionality of Apache Superset is not enough, and then you need to start refining it for your needs, which Superset allows you to do.
Task from the customer
Our customer had a request to implement the report, which was supposed to work with a lot of data that additionally needed to be processed and summarized. The pivot tables supplied by Superset out of the box are not designed for this either in speed or, if possible, to display data in batches, and not all at once.
When we tried to output data with the built-in capabilities of these tables and raised the number of rows to the limit set by the developers of Superset, this was not enough for the existing data granulation. Instead of the expected data for six months, the client saw only data for barely 1.5 months.
When we tried to increase this number in an existing version of the PivotTable, we encountered performance problems. Firstly, a page with data for three months could load for 15 minutes, working with difficulty in principle, and when trying to output data for at least six months, the browser completely "fell" due to lack of memory.
Thus, the existing pivot table could not suit our customer in any way, because it was calculated, according to the developers' idea, only to reduce a large amount of data to a small number of rows, but if the resulting number of rows was more than the number they set as a limit, then the table stopped working acceptably. A significant revision was needed, which will be discussed below.
Rework plan
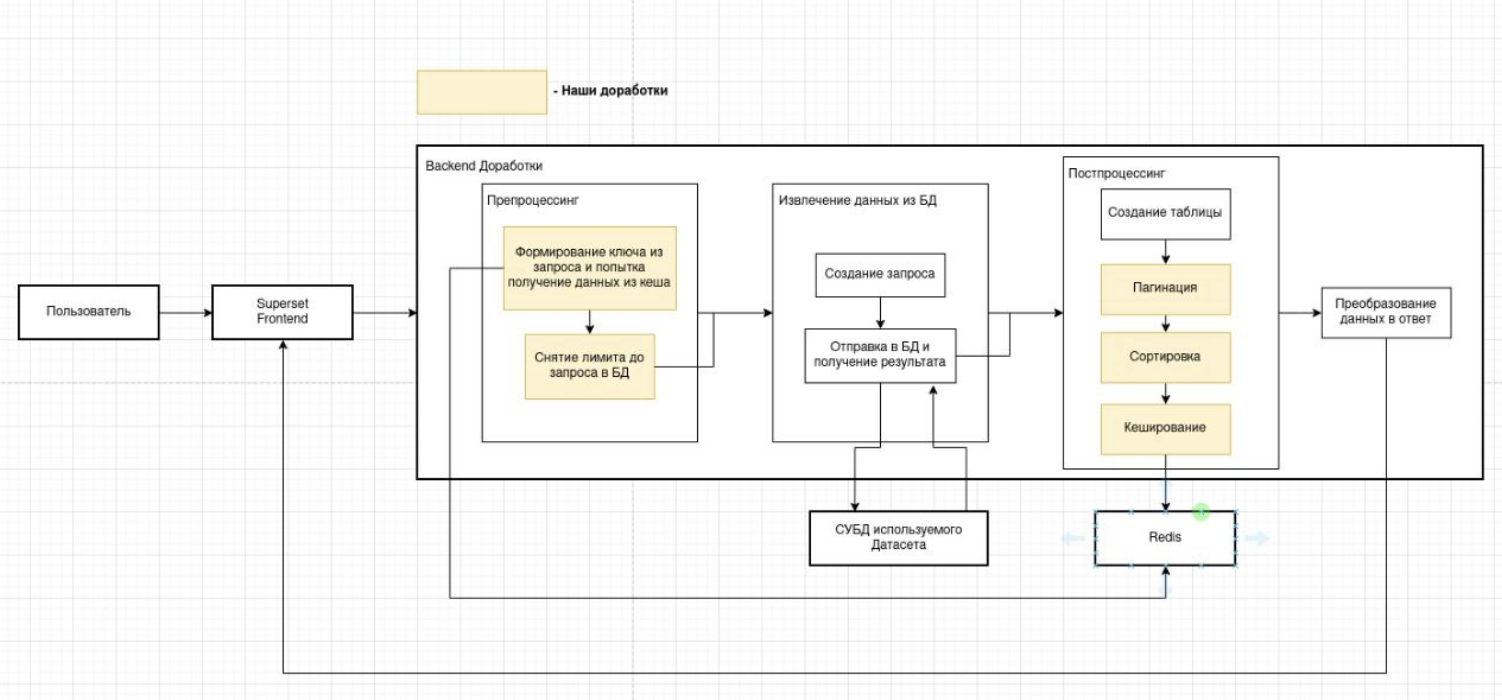
It was decided to implement the following functionality:
- Prepare data.
- Add pagination by analogy with a regular table.
- Also, to sort by columns on the backend, since we moved the data generation there. Only there now we can do the correct sorting.
- Add caching to the result so that you do not need to recalculate data every time and constantly access the disk when changing pages or sorting.
Implementation of improvements
Подготовка
Since we create this refinement for working with a large amount of data, we will also need to remove the limit on the request in the database for these requests. Therefore, if the request came to our new table, we will manually remove this limit using the following code:
In addition, we needed to create our own post-processor. and at first we will simply duplicate the second version, but with our name and add it to the list of all post-processors:
Pagination
There was another requirement of the customer - this is the implementation of backward compatibility with the previous version of the PivotTable, so we will make pagination optional and will apply it only when the server_pagination variable is passed in the query in true. We will implement pagination after post-processing, where the final DataFrame will be formed in our country. The original code is as follows:
And to add pagination, we'll change it to the following code:
In total, at the moment we already have a ready-made pagination that will work regardless of the volume of your database.
Caching
However, we still need to add caching to this, since otherwise constant requests to the database and disk per page would cause recalculations of the entire PivotTable.
Here we expanded the code that we added in the preparation step, adding to it an attempt to retrieve data from the cache before querying the database. Here we should also decide what we will use as the key for our cache. We decided to use the form_data object that we transfer in each request to this endpoint, which contains all the unique data for a particular request, and we just needed to remove from there those variables that are responsible for pagination and sorting, since it is from them that our request to the database does not change. The generate_cache_key function that already exists in Superset will allow us to generate the cache itself, which accepts any dictionary and returns a unique key to us.
Let's create a separate function for this:
Now let's add an attempt to get data from the cache:
And, of course, since we are trying to get something from the cache, it would be nice to try to put something there, so we will add the code for this to our created post-processing:
Sorting
To sort our table, you need to insert the sort before pagination:
You also need to change the key generation function for the cache, taking into account the variables for sorting:
Results
Final result: summary table with pagination. And working sorting!
Conclusion
To use our PivotTable in your projects, you just need to apply the changes described above to your Superset, rebuild the Docker image and start using the new table!
Since initially, during development, we applied the changes only to our new table, your existing reports will not be affected in any way.
Now, for example, we have saved changes in the form of a patch for Apache Superset in our git. The patch can be applied to any of your versions of Superset, regardless of whether you have made changes to it.
Our solution can be a good addition to existing reports, it is universal and lightweight, so you can use it in projects of any complexity.
World after smart custom Open Source!
* Initially, the article was published on Habra in the Sandbox section, gained advantages and positive karma. This gave Arthur the opportunity to become a full author of Habra and continue to write useful articles.